
QR code analytics for campaigns, print and packaging.
See which QR codes are being scanned, when they are scanned, and what kind of devices are scanning them — without paying a monthly QR analytics subscription.
Measure what happens after printing
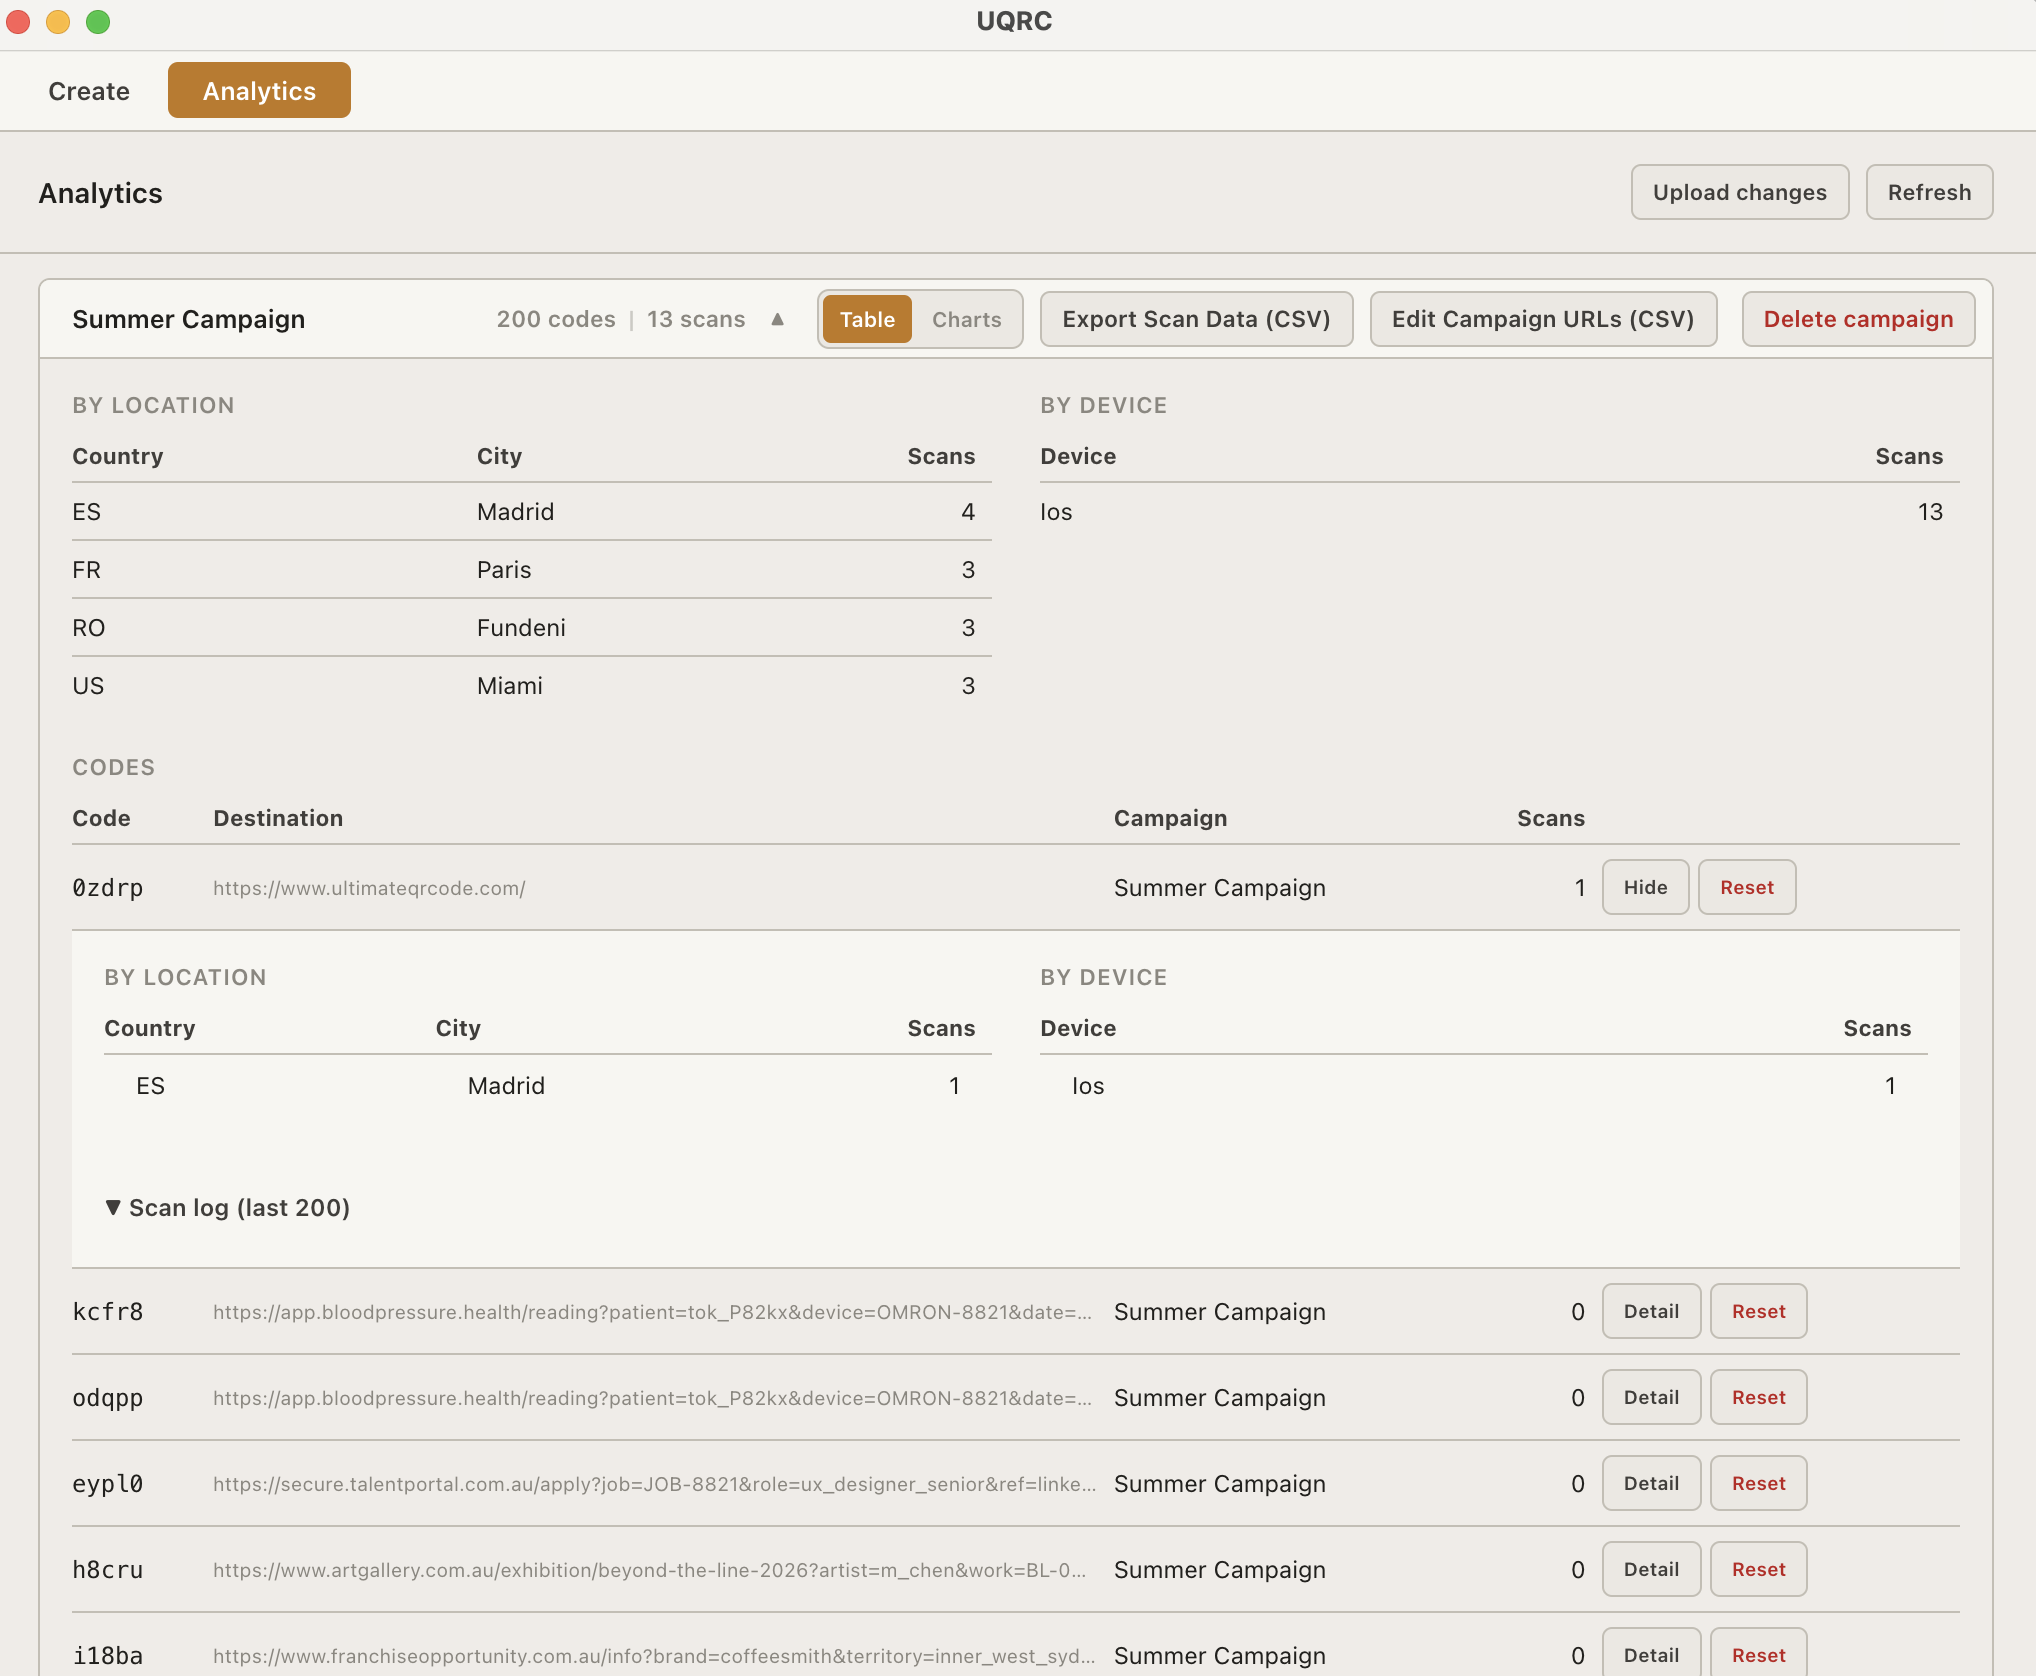
QR analytics are especially useful when codes are printed on labels, packaging, posters, flyers, menus, business cards or product inserts. Instead of guessing whether a campaign worked, you can review scan activity and compare performance across campaigns.
- View scan totals by campaign or individual QR code.
- Understand scan timing, location and device type.
- Export scan data for reporting and customer work.
- Keep tracking data in your own Cloudflare account.
Interactive charts and visual reporting
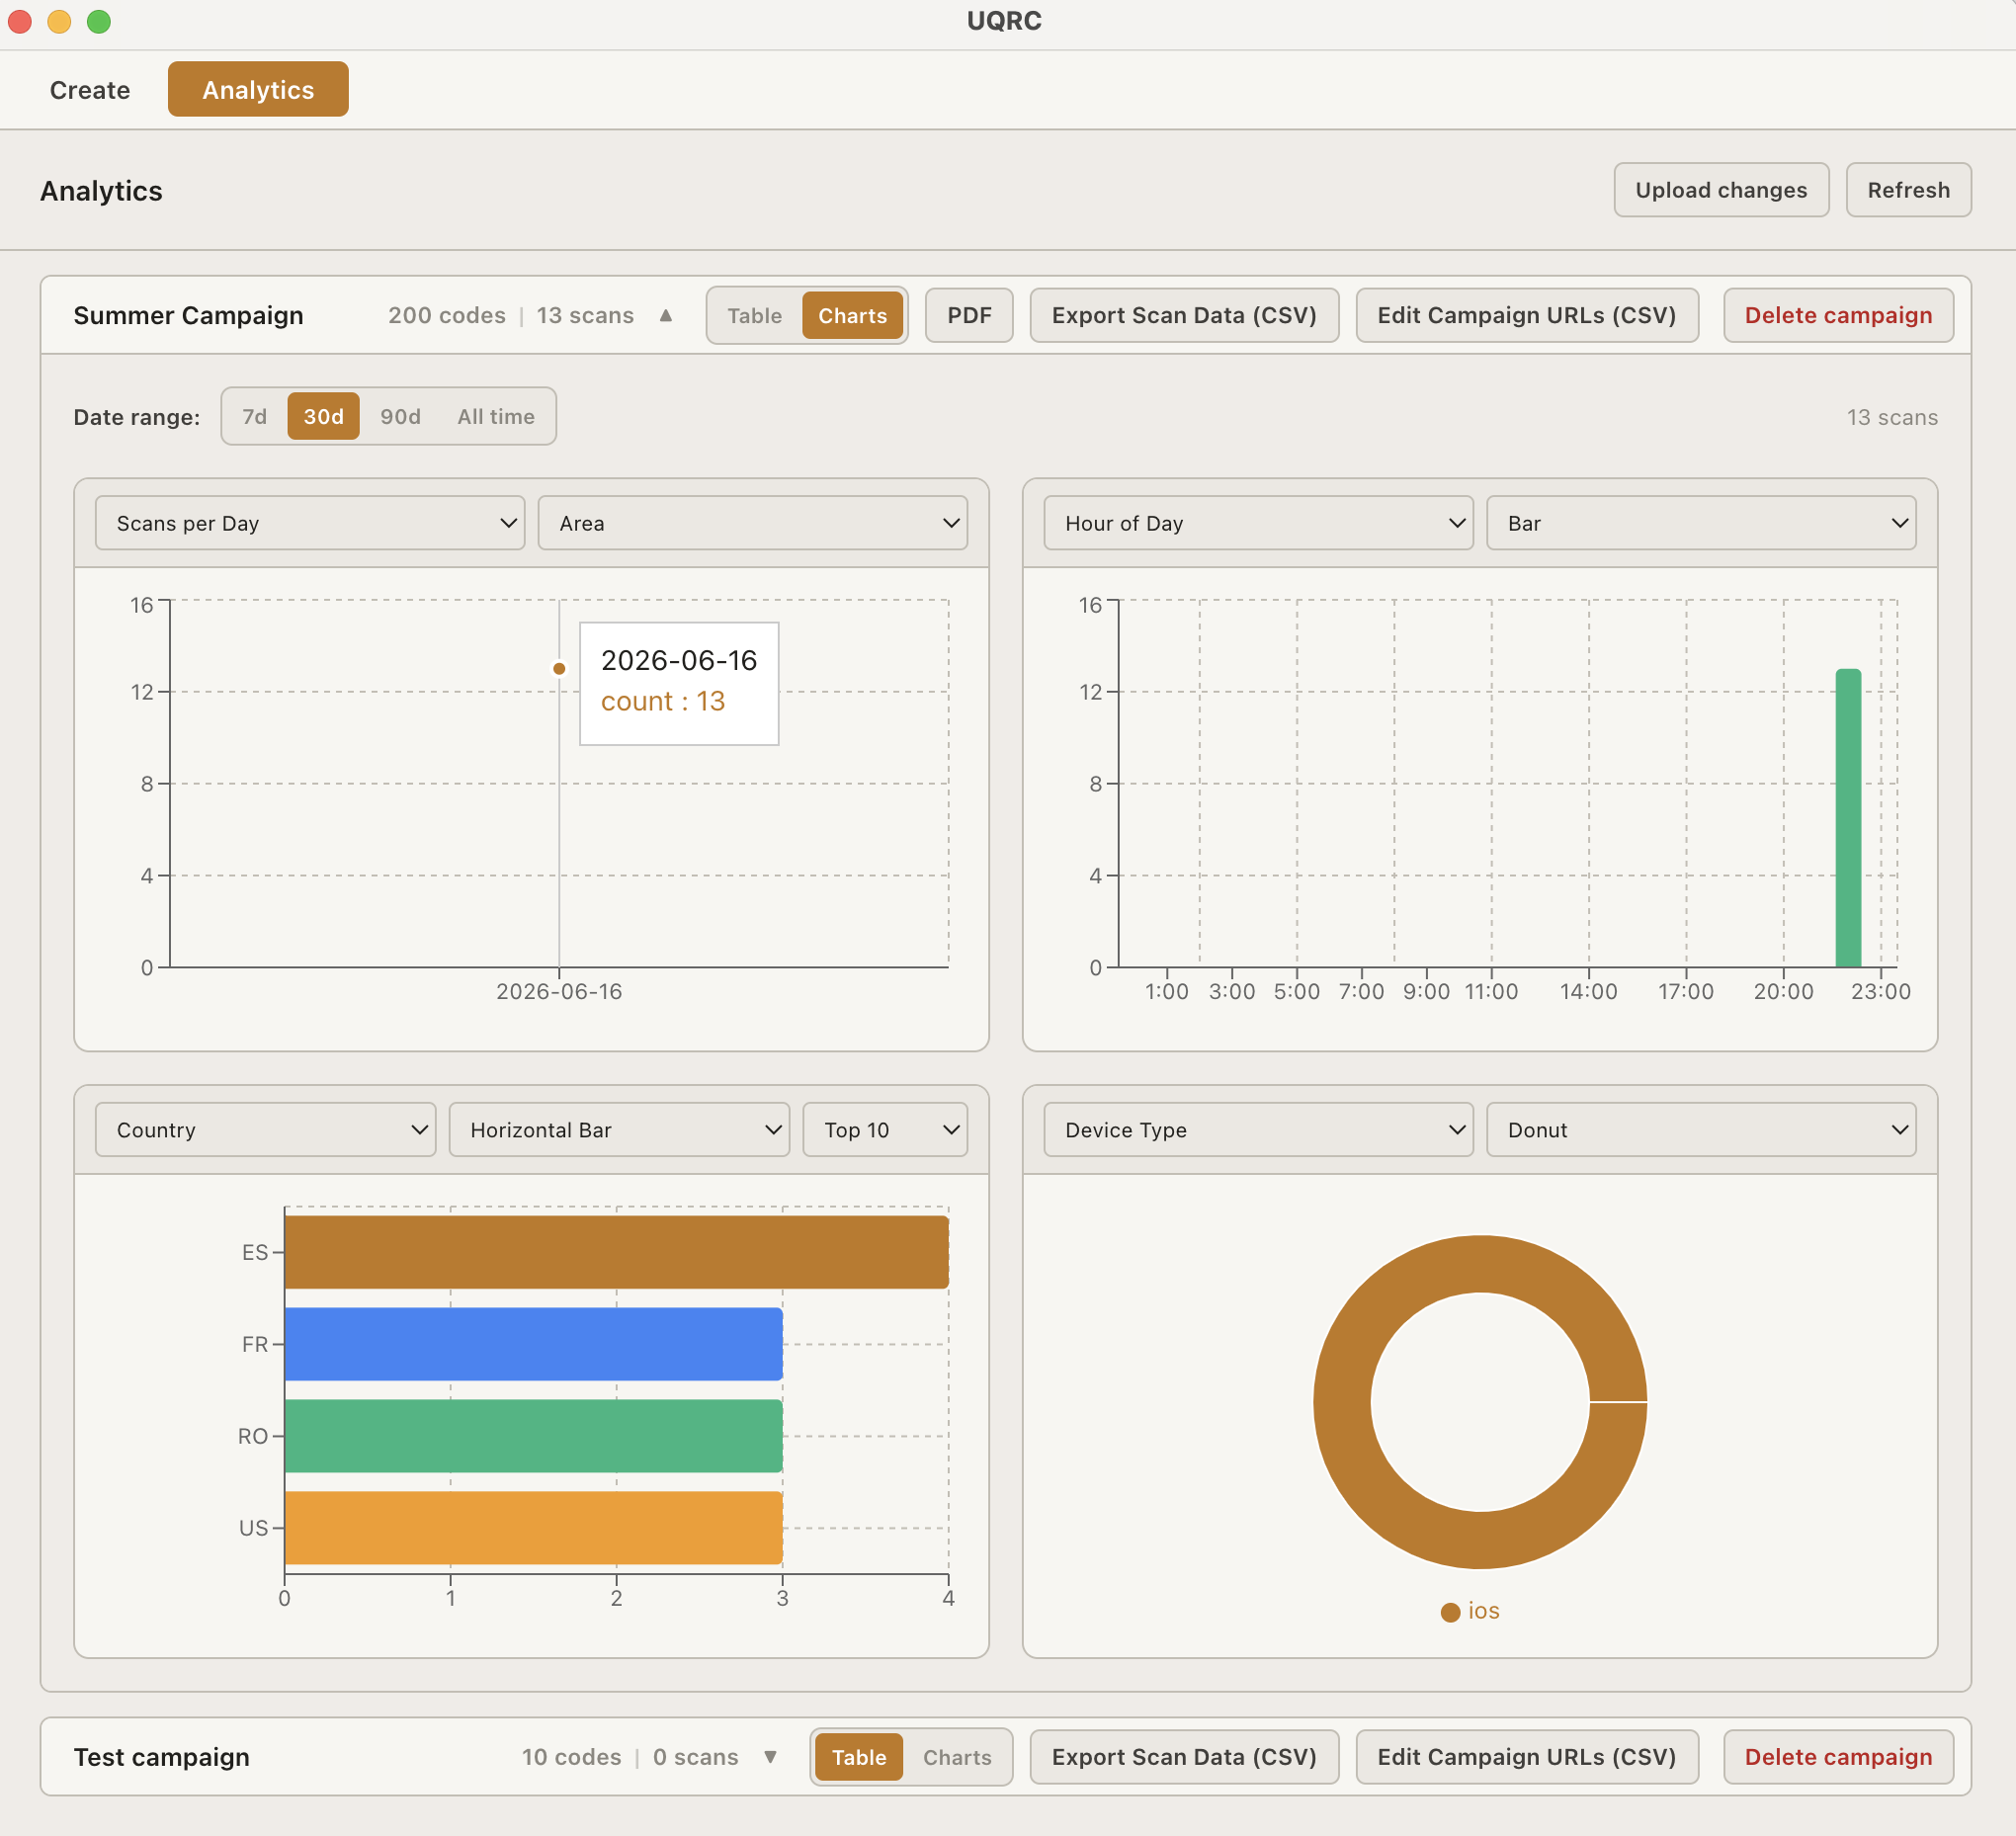
Switch to charts view to explore scan data visually. See scans over time, breakdowns by country and device, and hour-of-day patterns. Configure up to four chart slots with your choice of dimension and chart type. Export the full dashboard as a PDF for reports and client work.
- Area, bar, horizontal bar and donut chart types.
- Filter by 7, 30 or 90 days or view all-time data.
- Export the chart dashboard as a PDF report.
Analytics plus dynamic QR codes
Analytics becomes even more useful when paired with dynamic QR codes. You can track performance and change destinations later if a campaign page, menu, offer or product URL changes.
Create, track and update QR codes from one desktop app.
Ultimate QR Codes includes standard generation, print-ready export, dynamic QR codes and scan analytics for a one-time $39 purchase.
Buy Desktop App — $39Bulk QR code generation · Print-ready QR codes · Dynamic QR codes · QR code tracking